To control CPU resources, you need to use the requests and limits attributes
In short
Requests shows the CPU of the process in cgroups on the CFS scheduler Shares, and limit is the bandwidth limit on CFS
Requests and limits actually use different algorithms to control CPU resources
Let’s start with requests
Use – CPU shares in docker run to allocate CPU resources in proportion
For example, two containers
docker run --name c1 -itd --rm -c 1024 progrium/stress --cpu 6
docker run --name c2 -itd --rm -c 2048 progrium/stress --cpu 6
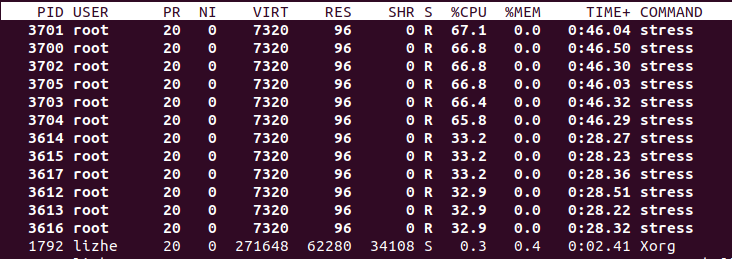
–cpu-shares shares can only provide a certain proportion of competition, so when there is only one container, the container can still obtain all CPU resources
docker run --name c1 -itd --rm -c 1024 progrium/stress --cpu 6
On kubernetes
The agileek / cpuset test image is used for pressure test. There are six cores with 16g of memory on node slave2
When there is only one S1 with 100m requests and only one replica, it can still eat 100% of the CPU because there is no competition
    name: s1
    resources:
      requests:
        cpu: 100m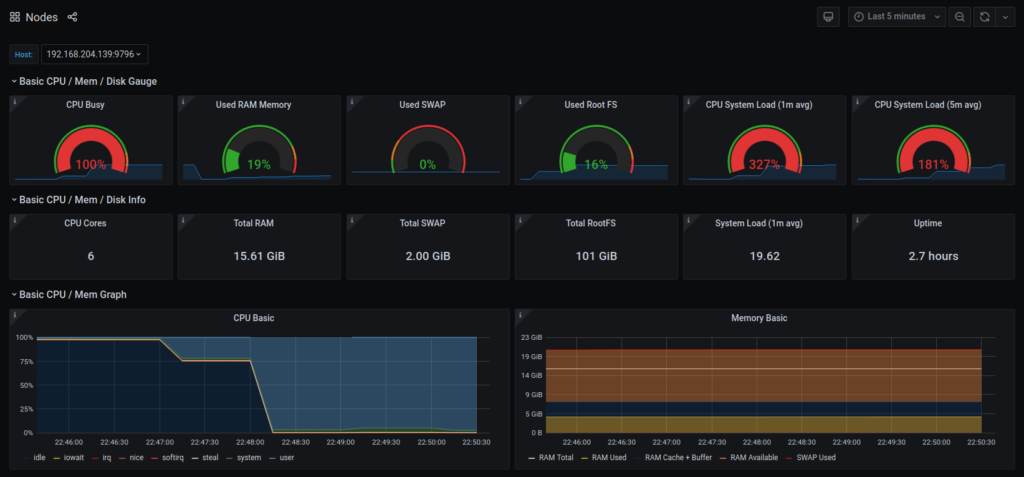
Unfortunately, this image does not seem to support a special number for multi-core CPUs. I have six cores on this node. Here, I need to adjust replica to 6 to eat up all six cores on this node
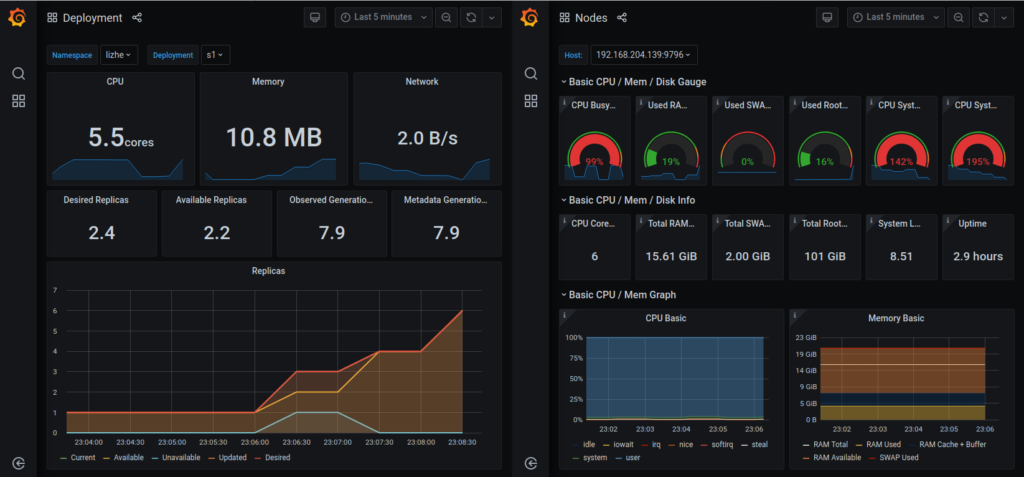
We join a competitor, clone S1 to S2, and adjust requests to 50m on S2
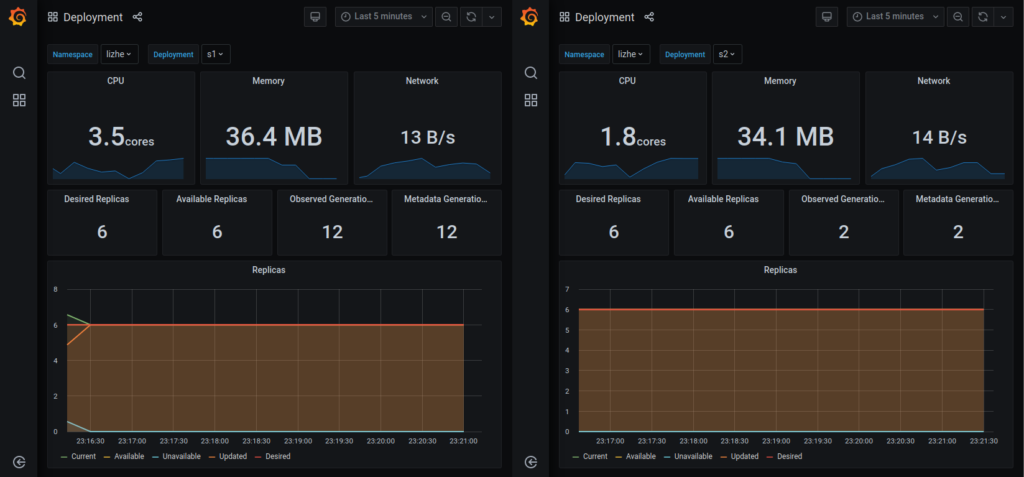
Finally, on the slave2 node
s1 (100m)* 6
s2 (50m) * 6
It can be seen that the CPU occupancy ratio of S1 and S2 is gradually approaching 4:2
Limits shows the CPU cfs_ period_ Us and CPU cfs_ quota_ Us attribute
cpu. cfs_ period_ Us: set the time period (in microseconds)( μ s) ) must be the same as CFS_ quota_ Use with us.
cpu. cfs_ quota_ Us: set the maximum time (in microseconds) that can be used in the cycle( μ s))。 The configuration here refers to the maximum usage of a single CPU by a task.
For example, set the limit to 50%
Set CPU cfs_ quota_ Us is set to 50000, relative to CPU cfs_ period_ 100000 US is 50%
set up
s1 requests 100m limits 100m
s2 requests 50m limits 50m
Will get
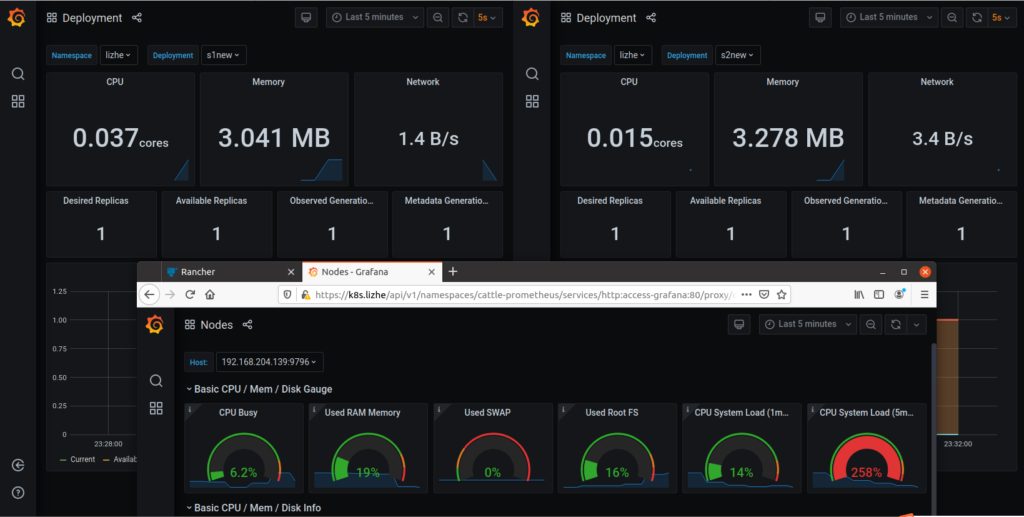
In this case, the total CPU utilization directly drops to 6%, and the kernel application curve almost drops to 0

